fonte: NOAA
LE FONTI DEI DATI
I dati del clima e delle emissioni serra a livello globale
I dati globali I dati italiani
NAZIONI UNITE
UN DATA
Climate change and Greenhouse gases
UNFCCC
I dati climatici della Convenzione globale sul clima

Greenhouse Gas Inventory Data - Detailed data by Party
UNEP
Environmental data Explorer: Climate change
WORLD BANK
WMO
World Data Centre for Greenhouse Gases
IPCC
OECD

EUROPA

EUROSTAT
EEA
GHG emissions by aggregated sector
JRC ISPRA
PBL
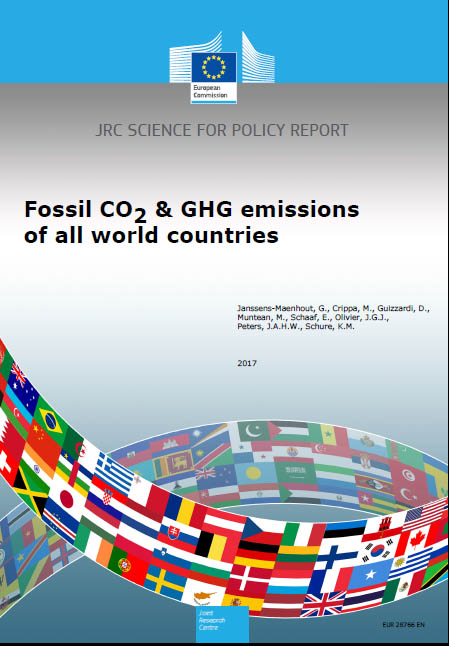
Trends in global CO2 and total greenhouse gas emissions
STATI UNITI
WORLD RESOURCES INSTITUTE
DOE ESS-DIVE
Environmental Systems Science Data Infrastructure for a Virtual Ecosystem
CDIAC
ON LINE TRENDS
Global Carbon Project


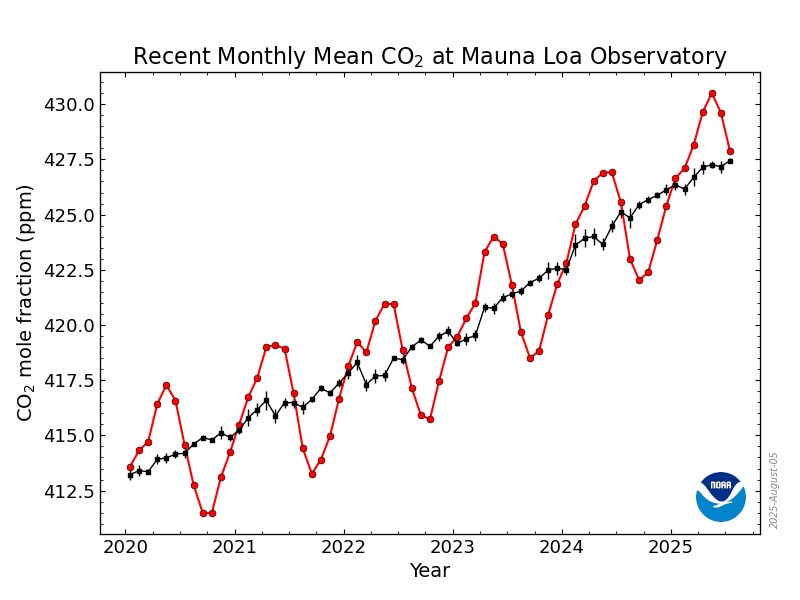
2025: Concentrazione globale media (MAUNA LOA) della co2
(fonte: NOAA)
 J
J
July 2025: 427.87 ppm
July 2024: 425.55 ppm
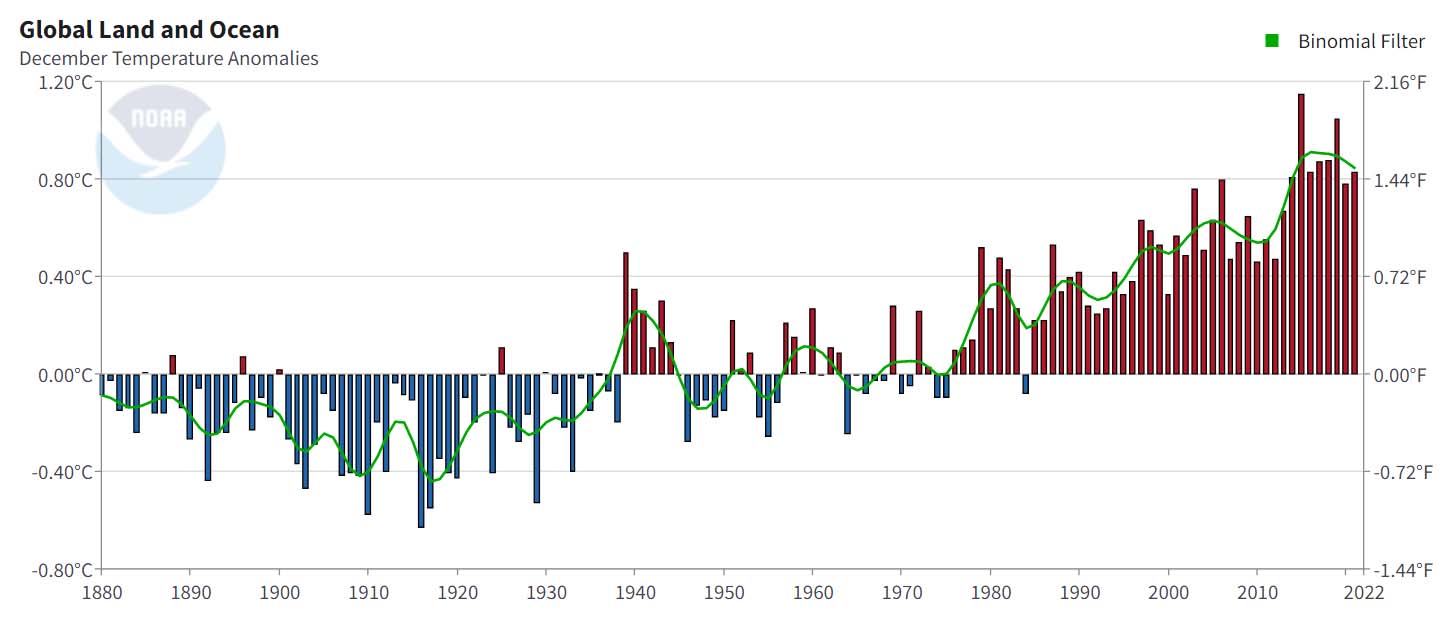
2025: ANOMALIA TERMICA media superficiale globale RISPETTO ALLA MEDIA DEL 20° SECOLO
(fonte: Copernicus)
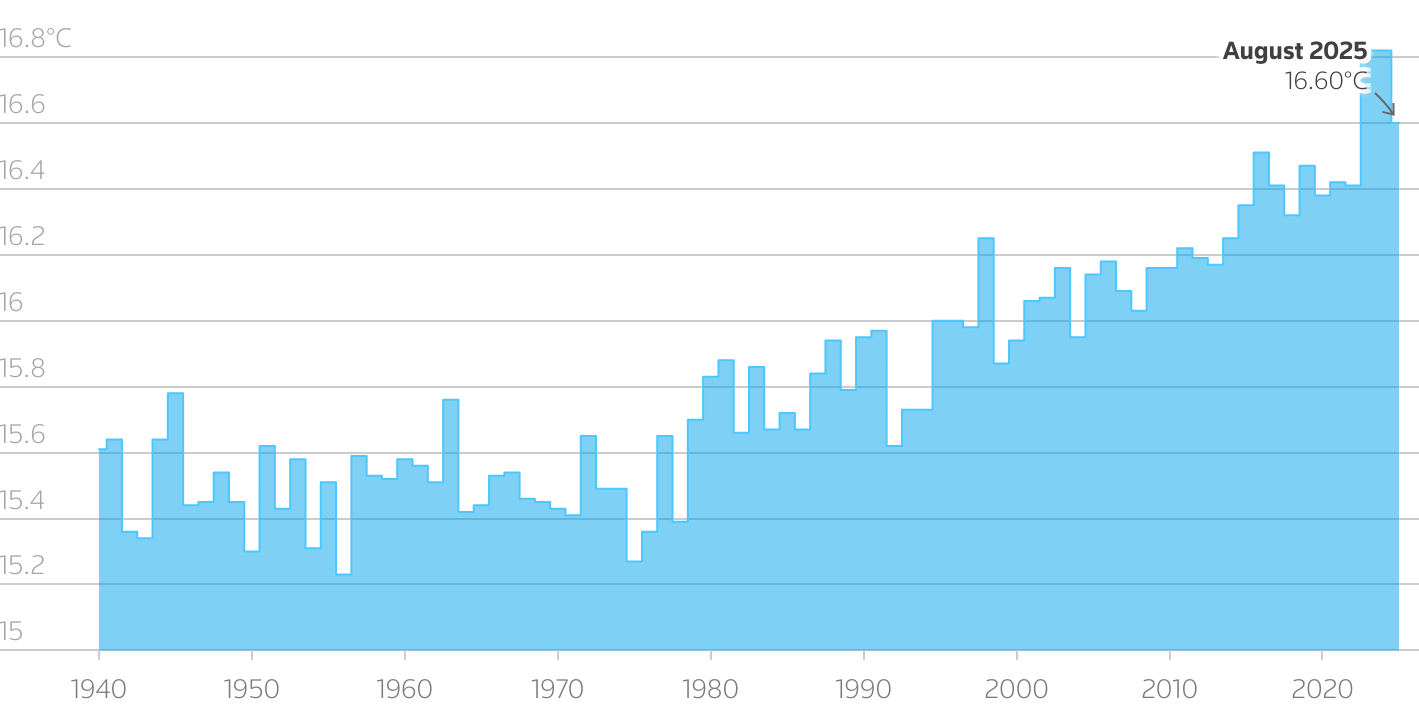
2025: TEMPERATURE GLOBALI MEDIE IN AGOSTO
(fonte: ECMWF)
2024: EMISSIONI DI GHG GLOBALI
(fonte: Statista)
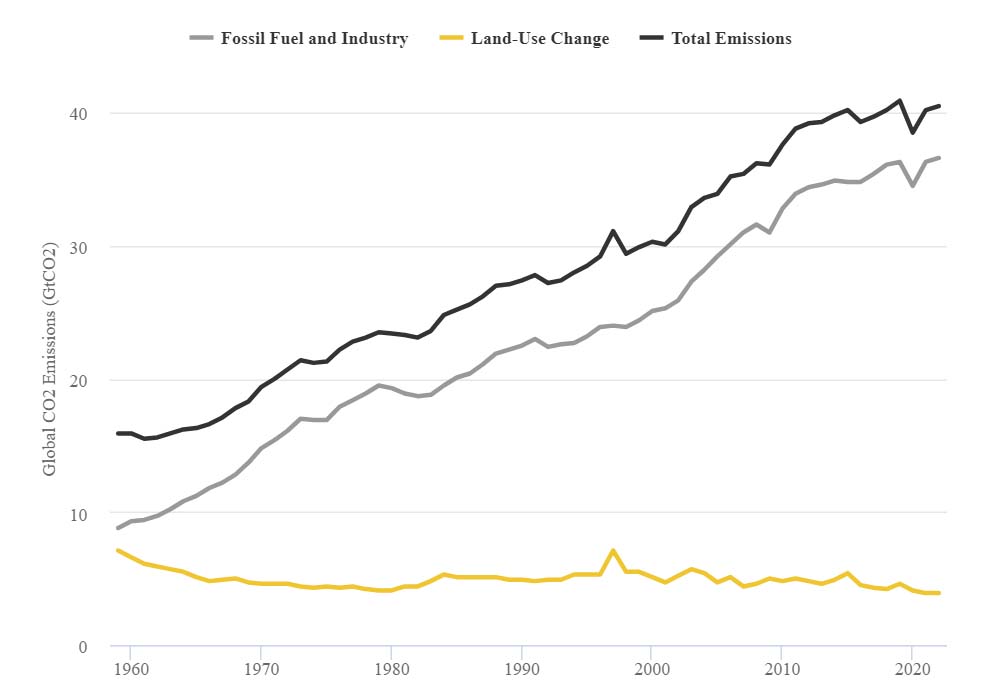
2024: 50 Gt di EMISSIONI GLOBALI di CO2
DA FOSSILI E LUC(fonte: GGP, Global Carbon Project)
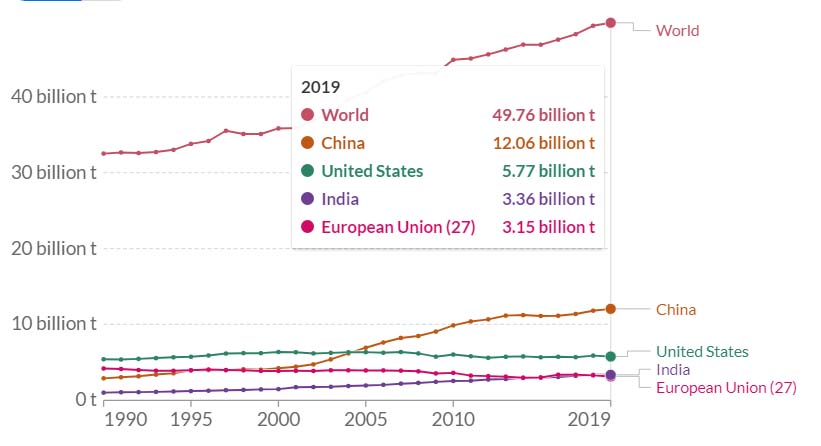
2025: DATI GENERALI DI EMISSIONI DI CO
2 PER PAESE(fonte: worldpopulationreview)
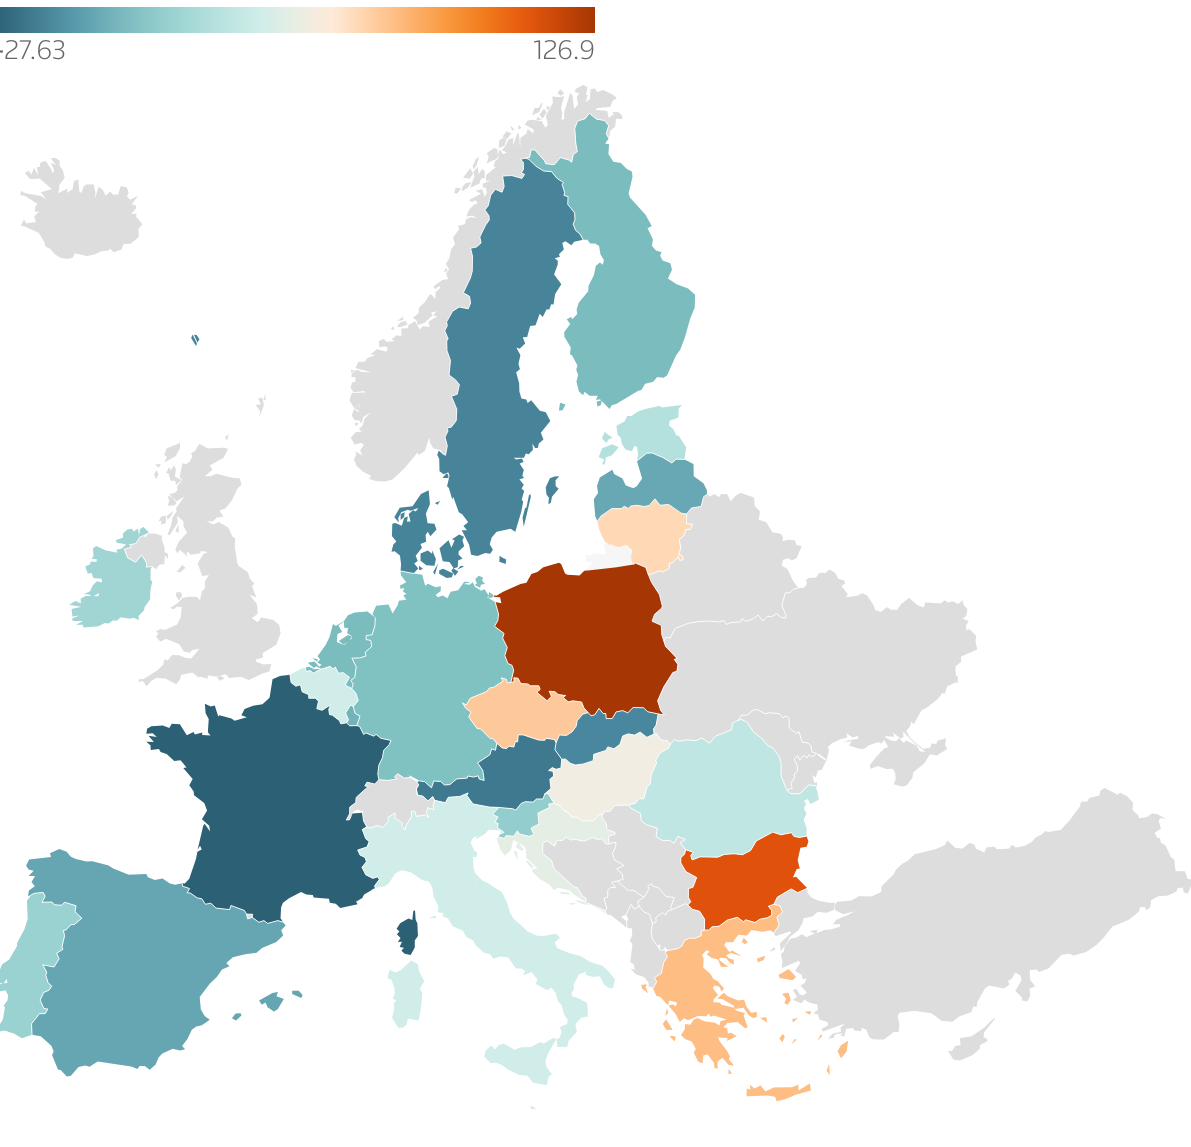
2023: Indice di rischio climatico ed energetico in Europa
(fonte: Energy and climate risk index)
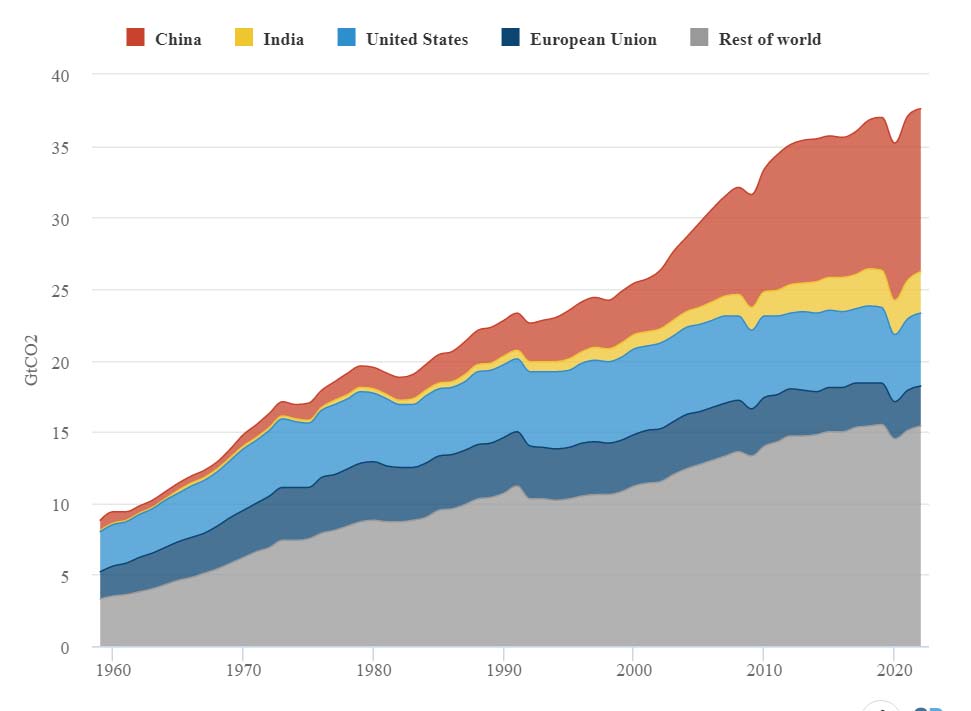
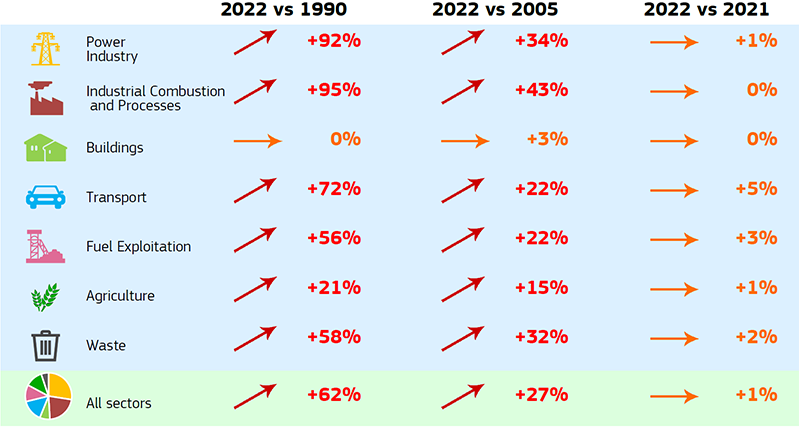
2023:
Trend delle emissioni di CO2 per settore(fonte: Edgar)
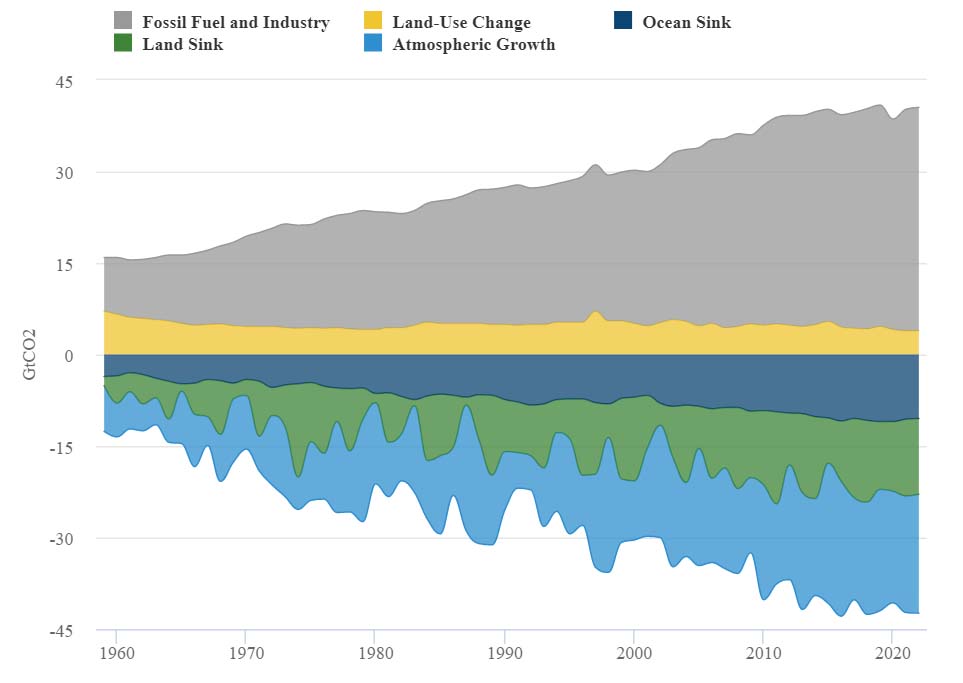
2022: CARBON BUDGET EMESSO ED ACCUMULATO AL 2022. 19,9 Gt accumulate in ATMOSFERA
(fonte: GGP, Global Carbon Project)
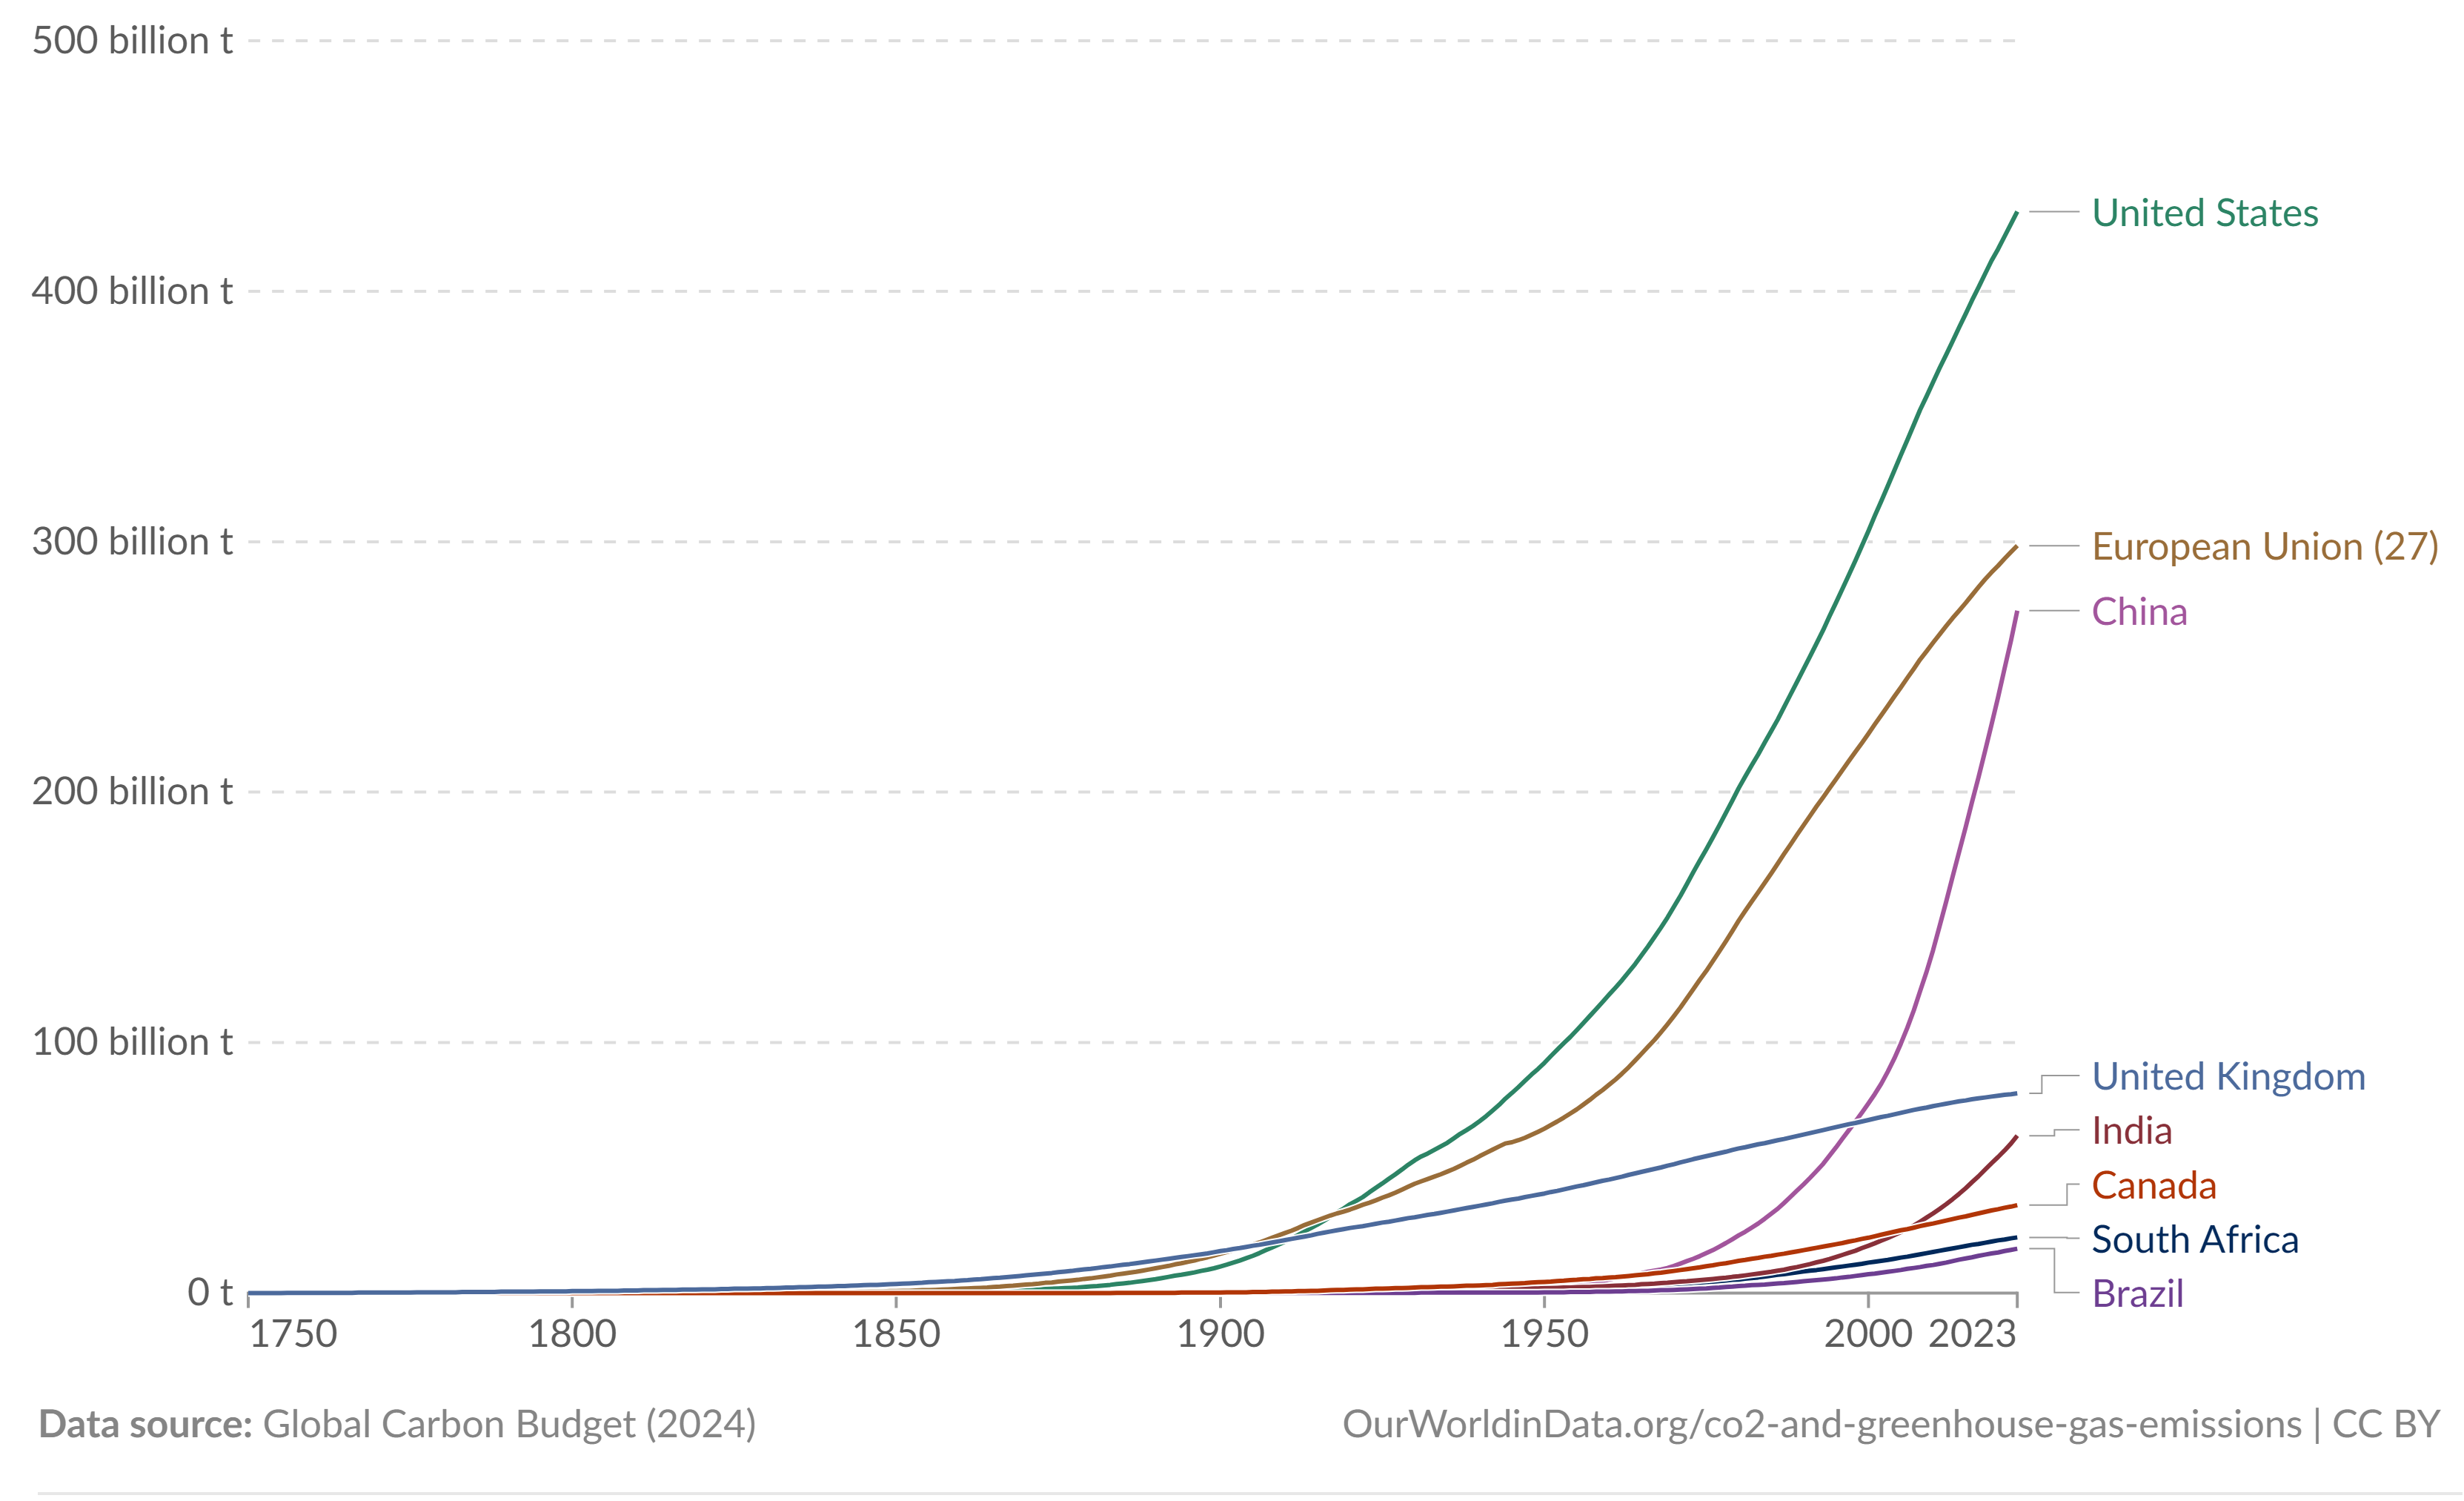
2022: EMISSIONI STORICHE CUMULATIVE DI CO2 DAL 1750
(fonte: Our World in data)
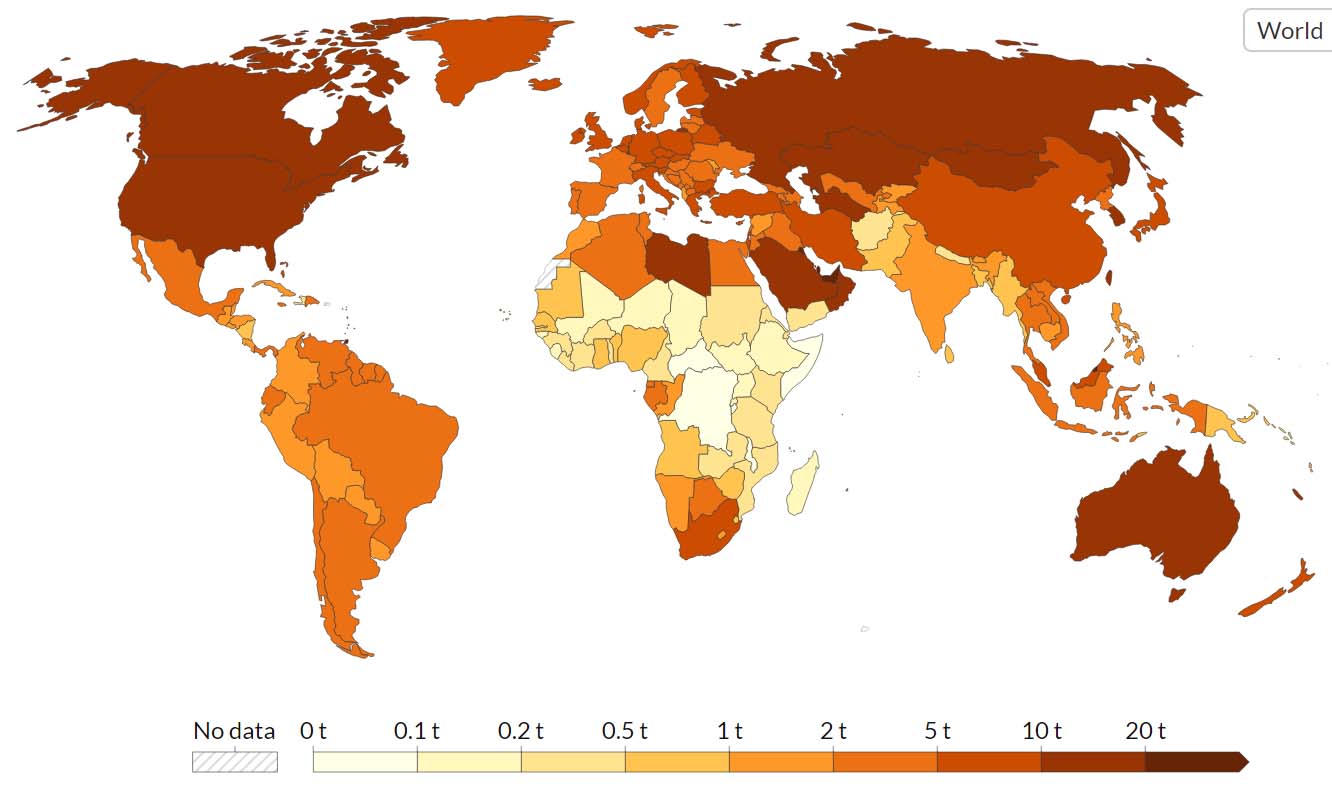
2021: EMISSIONI DI CO2 pro capite IN
t/yr(fonte: IEA)
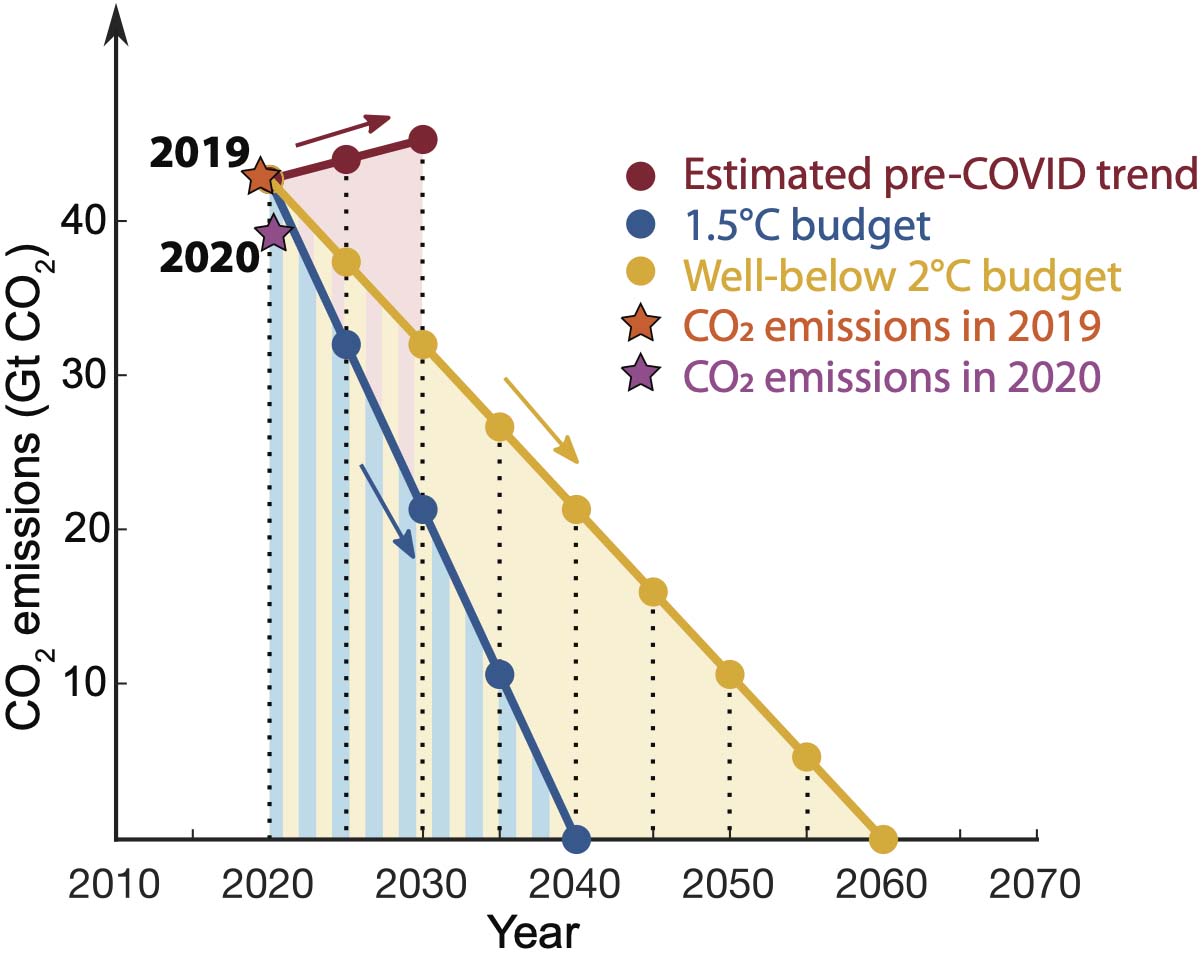
2020: Carbon budget (AREE TRIANGOLARI) RIMANENTE PER 1,5 (440 Gt) e 2 °C (860 Gt)
(fonte: Carbonbrief)
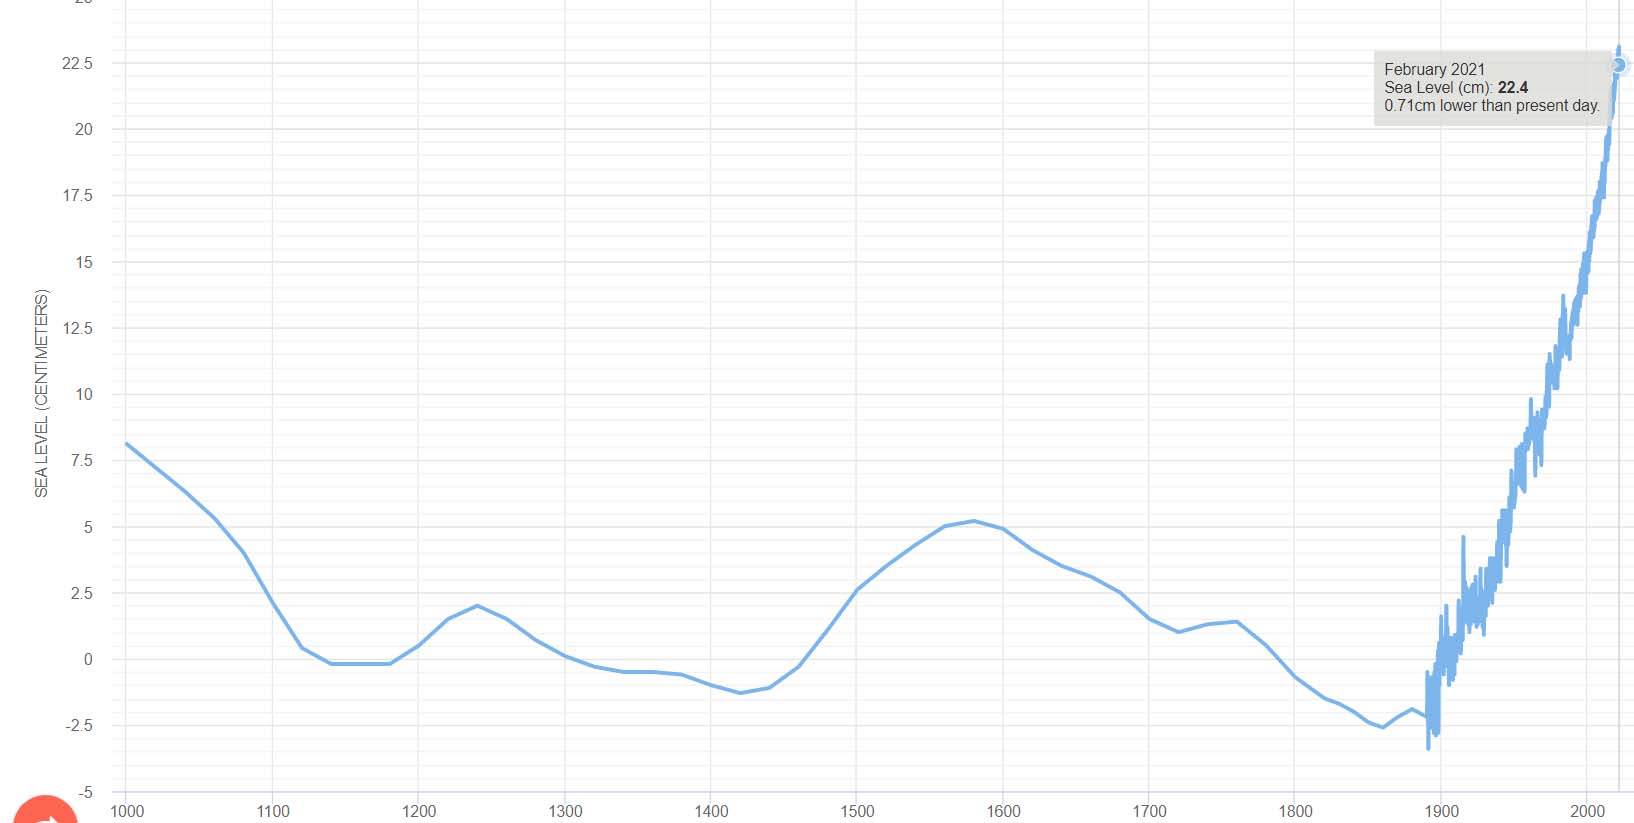
2023: Livello medio del mare IN cm
(fonte: sealevels.org)
2021: FAttori di Emissione standard nella generazione elettrica da fossili in kg/MWh
(fonte: IPCC)
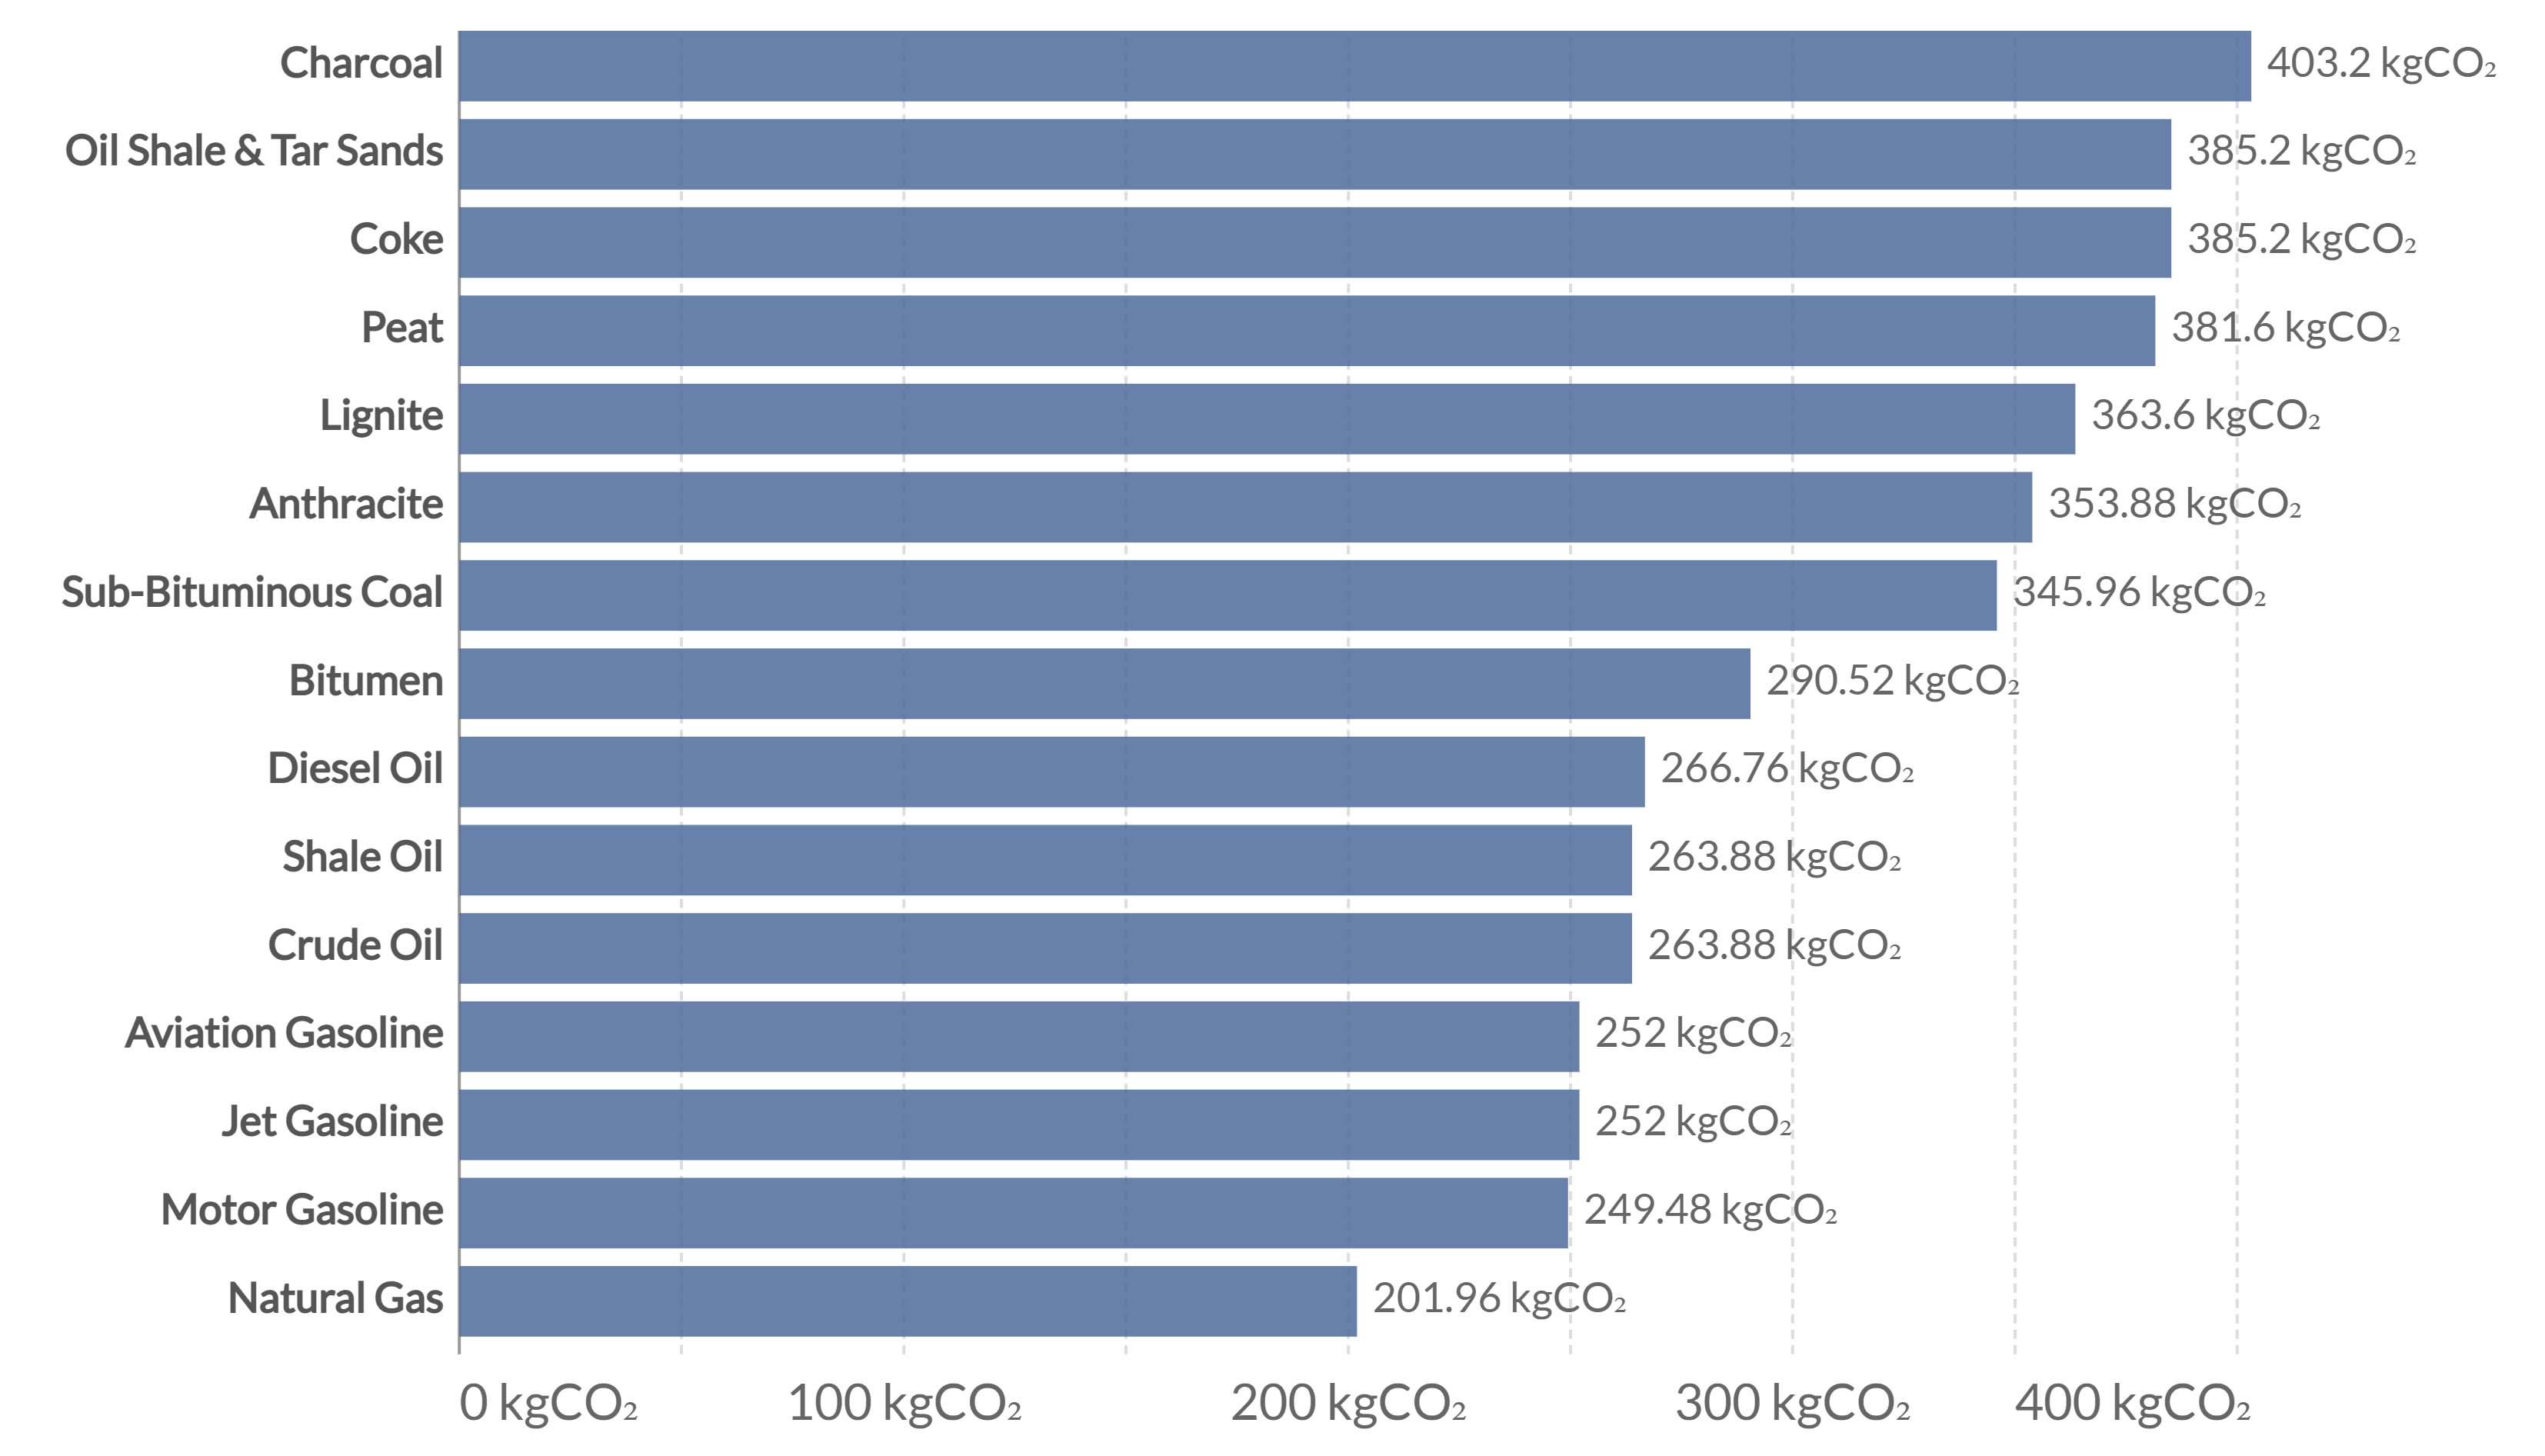
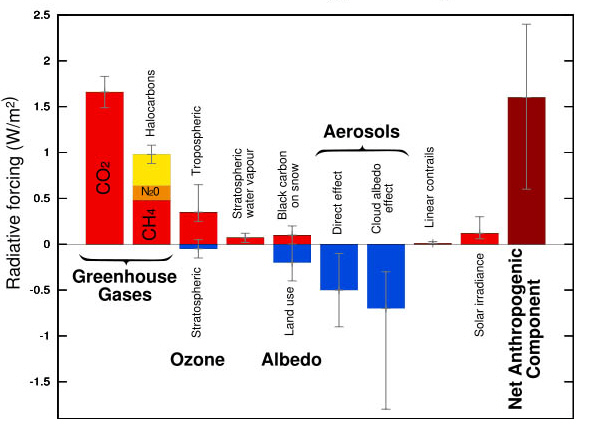
Figura 4. Forzanti radiative
(Fonte IPCC TAR 2005)
Comitato Scientifico
della Fondazione
per lo Sviluppo sostenibile
Via Garigliano 61a,
00198 Roma
![]() Tel.:
+39 06 8414815
Tel.:
+39 06 8414815
www.fondazionesviluppo
sostenibile.org

Coordinatore: Toni Federico (email:federico@susdef.it)
Storia e tendenze dello sviluppo sostenibile La Green economy Clima Energia Trasporti Territorio

